Observability in WDQMS
This post is about why and how metrics were introduced to WDQMS and how they improved the observability of the system.
Four reasons motivated the team to implement metrics. First, the need to better understand the complex data-processing jobs and their interactions. Second, to improve error detection and alerting, particularly concerning the routine data-processing jobs. Third, to know more about the resource usage of Kubernetes cluster and PostGIS database. Finally, the desire to gain additional insights of system usage by the public and evolution of information in the system.
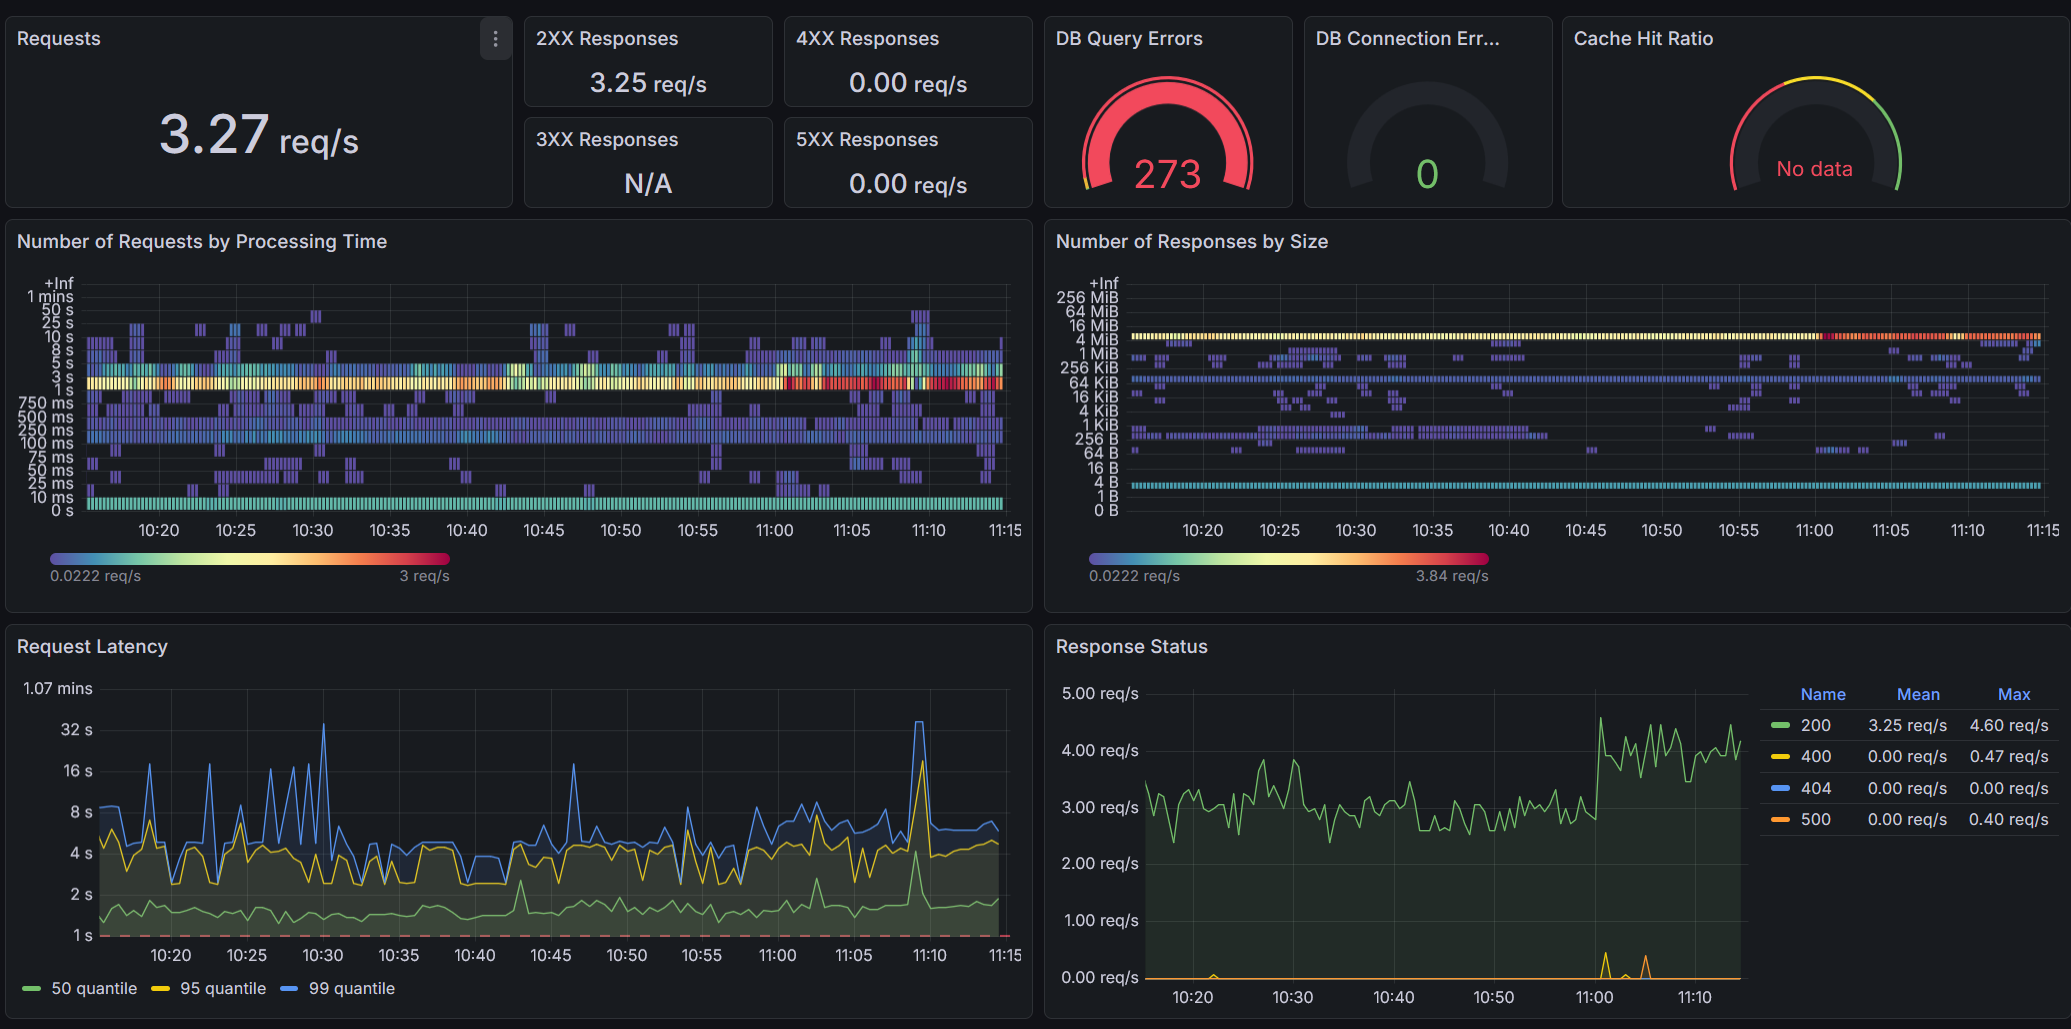 Grafana dashboard showing parts of the Django metrics.
The remainder of the post discusses the reasons motivating the introduction of metrics, and how the system architecture was changed to implement them.
Cron-jobs
Around 25 periodic jobs form the base of WDQMS data-processing. Implemented as Kubernetes cron-jobs, they obtain data from different data-sources and aggregate data for display in the system. Cron-jobs run at different times of the day and with varying frequency. Since some jobs depend on successful completion of others, and WDQMS lacking a scheduler able to orchestrate dependencies between jobs, the start times are set so that dependent cron-jobs are launched after the typical end date of jobs they depend on. For example, the data aggregation jobs are launched two hours after the data-fetching jobs obtaining data from NWP centers, which typically run for 90 minutes. To optimize the start date, an overview of the start time, end-time and running time of the various cron-jobs is needed, including their evolution over time and including their variance. Another reason requiring cron-job runtime parameters was to have a baseline to compare more efficient implementations of the algorithms to.
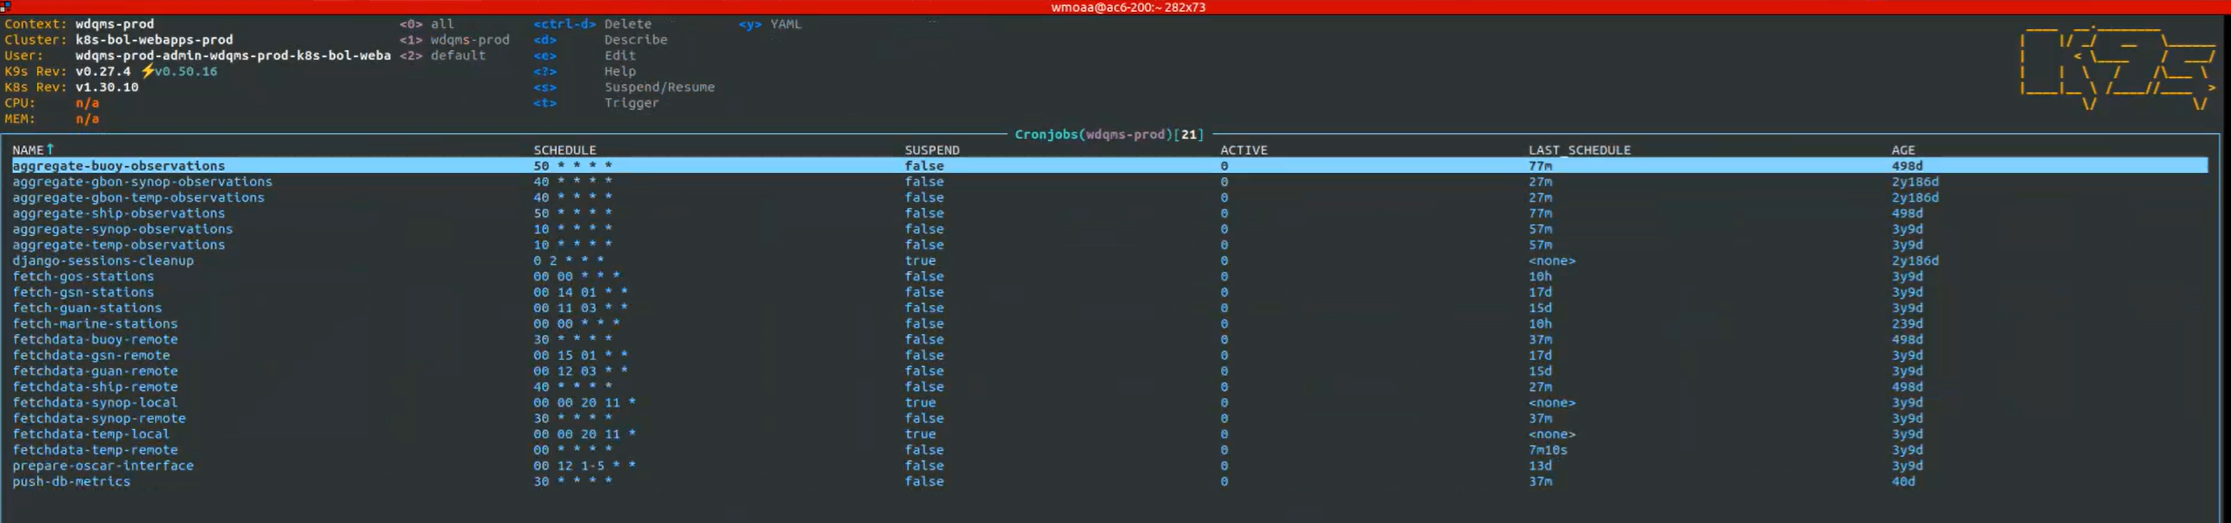 WDQMS data-processing jobs in the K9s console.
Cron-job runtime properties like start and enddate can be conceptualized as metrics, allowing analysis over time and using labels to distinguish between cron-jobs.
Error detection
Error detection is cricital in WDQMS, because errors in the data-processing mean that users do not see the latest data. While a log-file based system of error detection had already been implemented, it lacked a convenient approach to detecting jobs that failed without error message, for example when being terminated by the Kubernetes cluster or when jobs were not lauchend to begin with due to configuration issues. To debug problems the team also required more insight about how often cron-jobs failed over time and see this information in the context of other system parameters.
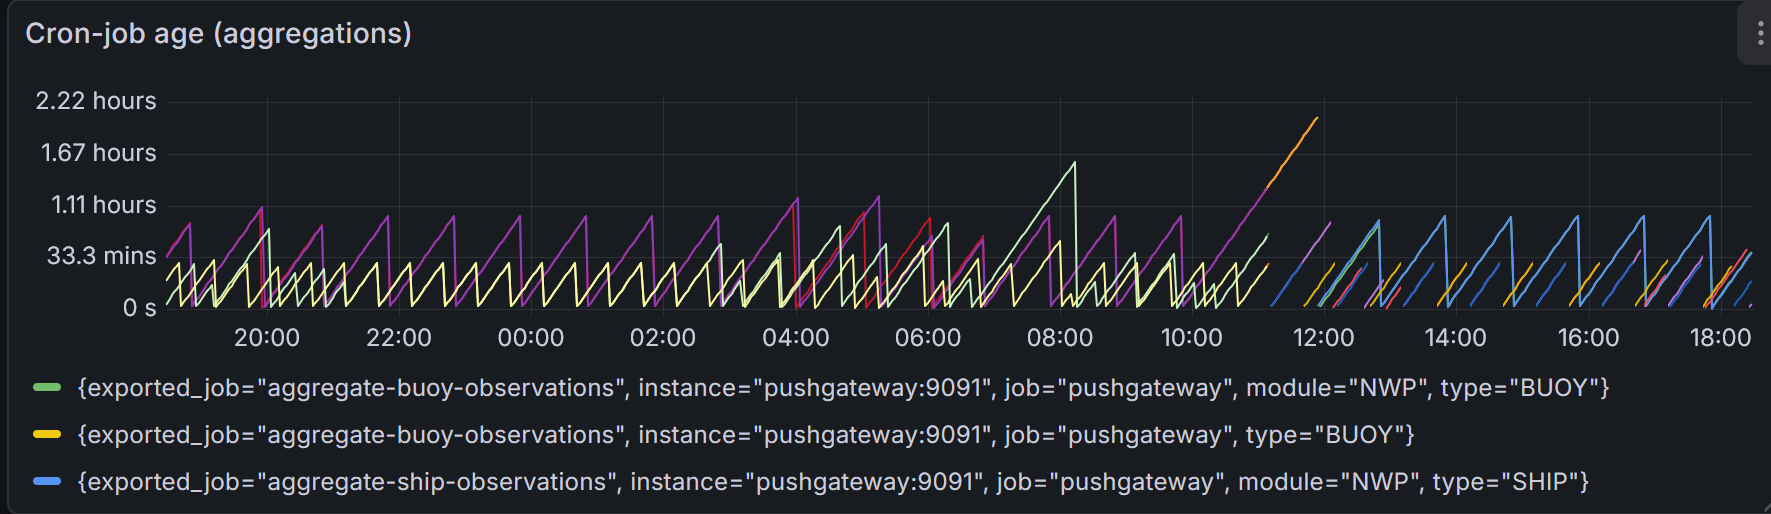 Dashboard visualizing the time since last succesfull completion of aggregation cron-jobs. Deviations from the regular see-saw pattern indicate failure of, or delay in, completion.
A metric representing the last successful completion of a cron-job can be used for alerting based on the age of the metric, and kubernetes also natively exposes metrics on cron-jobs through its kube-state-metrics agent.
Resource usage
The team also wanted to better understand the resource usage of WDQMS of the Kubernetes cluster and the PostGIS database, and how it evolves over time. An understanding of these parameters is important to plan the future system resource needs and also to effectively assess the impact of system optimization such as removal of unneeded indices.
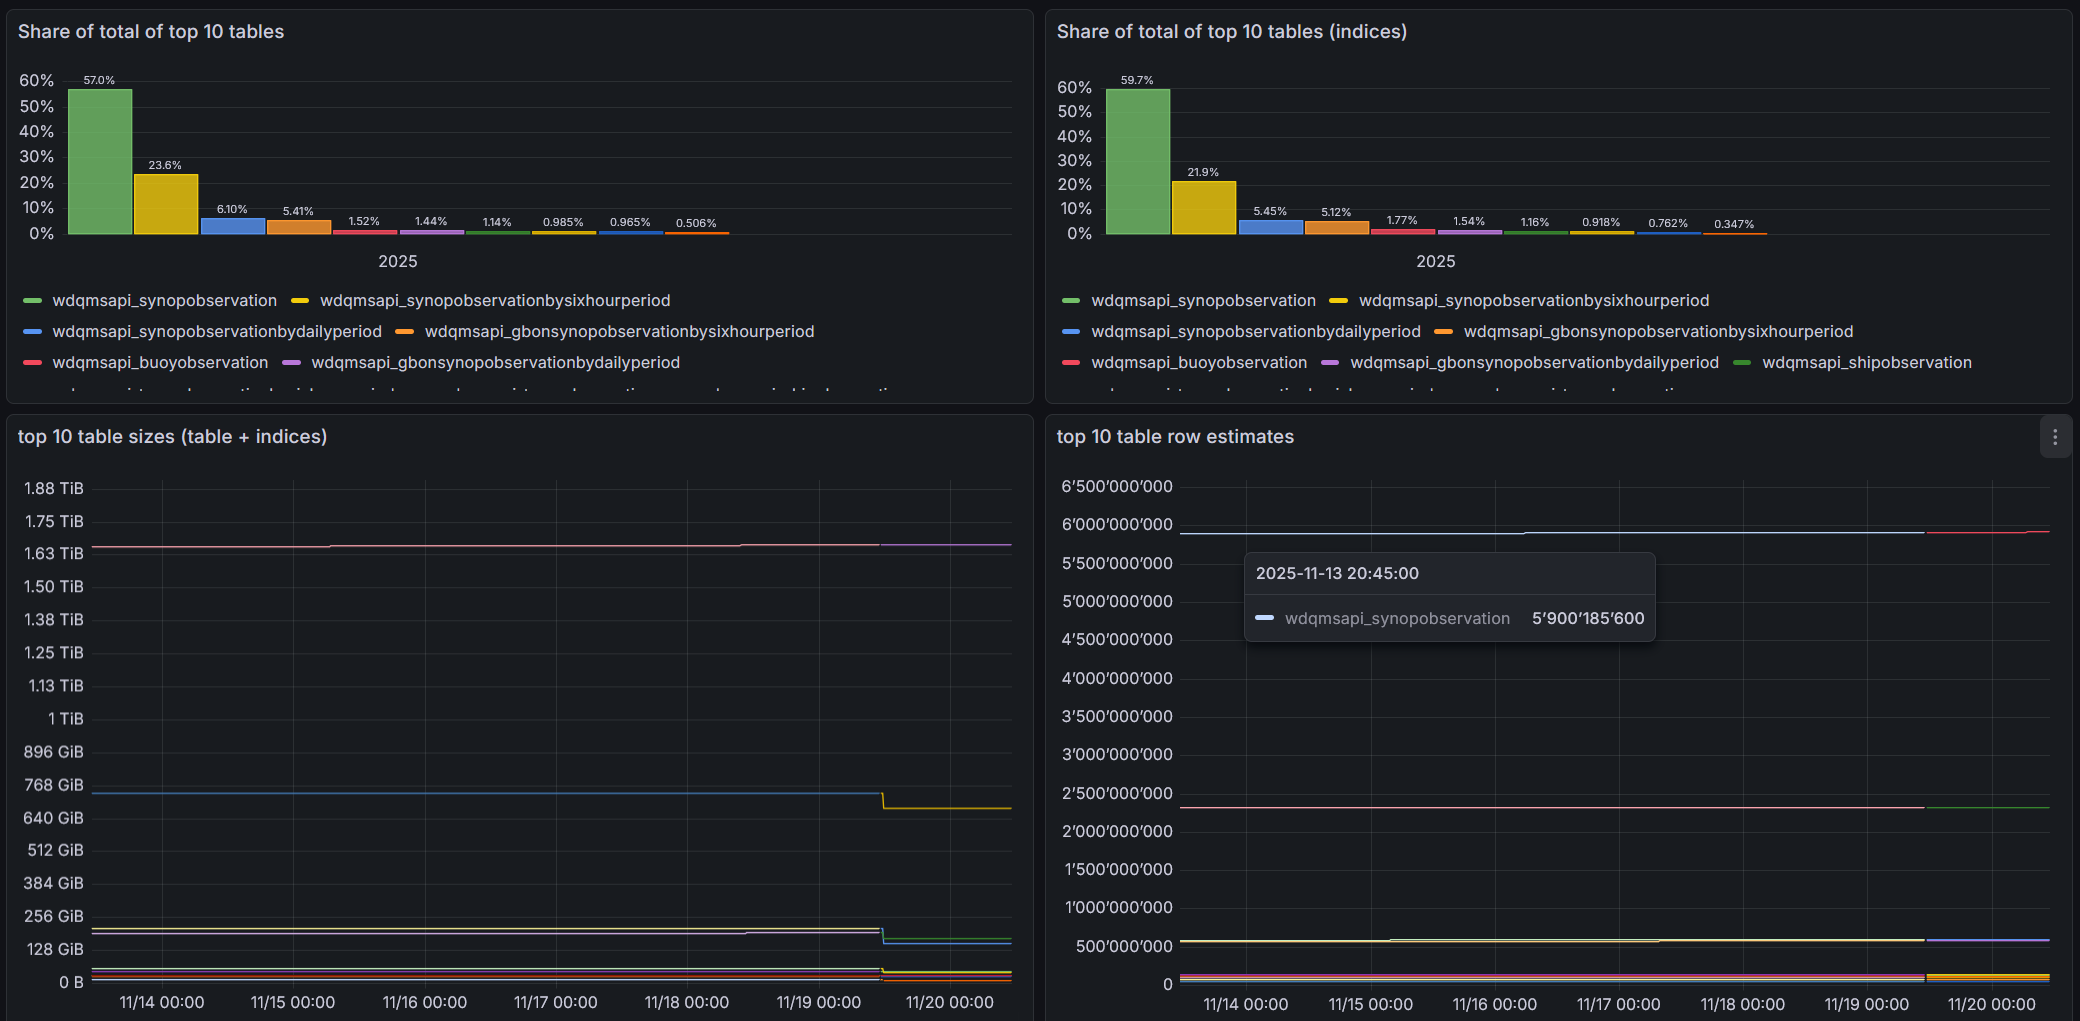 Dashboard showing table and index size and growth over time. The recent database optimization is visible by a drop in database size
Standard metrics exposed by Kubernetes and Postgres allow to analyze resource usage in terms of memory, CPU or disk-size over time.
Insights into public use and system evolution
Finally, the team also wanted to gain insight of how the public interacts with WDQMS, particularly which data is downloaded through the API and how frequently, and also understand changes to the data, for example changes to the station list, or number of new observations processed.
The number of downloads or number of observations processed can easily be conceptualized as metrics.
Observability architecture
The team decided to implement observability in WDQMS around OpenMetrics and the Grafana stack. A Prometheus instance gathers metrics from system components and exposes them to WMO’s Grafana instance, where dashboards and alerting are implemented. A pushgateway is used to expose metrics from ephemeral data-processing jobs. The figure below is a high-level representation of the system architecture for metrics.
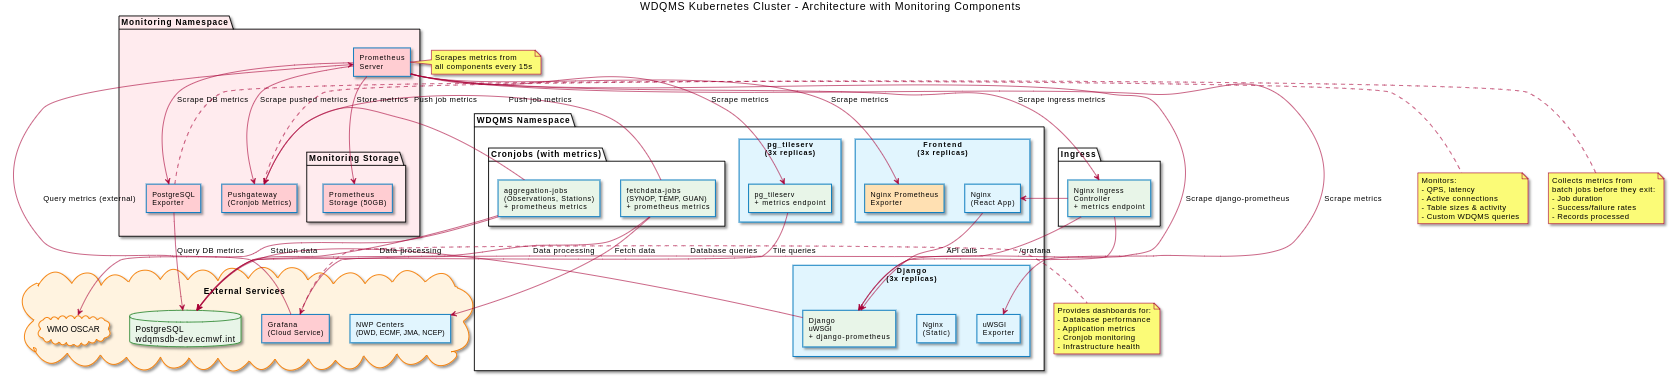 WDQMS observability architecture (Chart provided by Amro Abouelenein)
To implement the metrics cross WDQMS, the team first reviewed for each of the system components if it can natively expose metrics. Django and pg_tileserv, in addition to Kubernetes can expose OpenMetrics compatible metrics by updating the configuration, with Django also providing a convenient way to expose custom metrics through the same interface. The metrics tracking the number of downloaded files through the API were implemented in this way.
While the PostgreSQL and Nginx containers hosting the frontend code do not directly expose metrics in OpenMetrics format, an additional exporter component like Postgres-exporter and nginx-prometheus-exporter can be used to expose them to Prometheus.
Lastly, the data-processing cron-jobs, which are short-lived and can only be scraped with difficulty, use a Prometheus pushgateway to cache metrics. In the case of data-processing jobs, metrics are implemented in Python using prometheus client, and pushed to the pushgateway at the end of the processing. The role of the pushgateway is to cache the metric as provided by the job and make it available for scraping by Prometheus.
An example of providing the number of stations aggregated via the pushgateway below.
from prometheus_client import CollectorRegistry, Gauge, push_to_gateway
[..]
registry = CollectorRegistry()
g = Gauge('wdqms_nr_stations_aggregated', 'Number of stations aggregated', ['file_type','period_type'], registry=CollectorRegistry())
[..]
g.labels(file_type=self.file_type, period_type=self.period_model.__name__).set(len(df))
push_to_gateway(settings.PUSHGATEWAY, job="aggregations", registry=registry, timeout=10)
In addition to the data-processing jobs, a new cron-job was implemented to track custom database table metrics, like table and index size as well as number of rows. Implemented as Python program, it obtains table statistics from PostgreSQL by SQL query, and pushes them as custom metrics to the pushgateway.
dealing with infrequent events as metrics
While most components of WDQMS, like request rate or memory consumption, continously update metrics, the data-processing jobs only update their metrics as often as they are invoked, which can range from 30 minutes to 24 hours, well above the 15 second scrape-interval used by Prometheus. This presents a curiosity when interpreting the metric, as Prometheus continously scrapes a largely unchanged metric, giving potentially misleading information to an uninformed analyst.
The figure underneath exemplifies the issue. Only the y-axis represents the duration of the cron-job, whereas the offset on the x-axis, while suggesting to give information about the duration, remains static until the metric is next updated by the subsequent cron-job run.
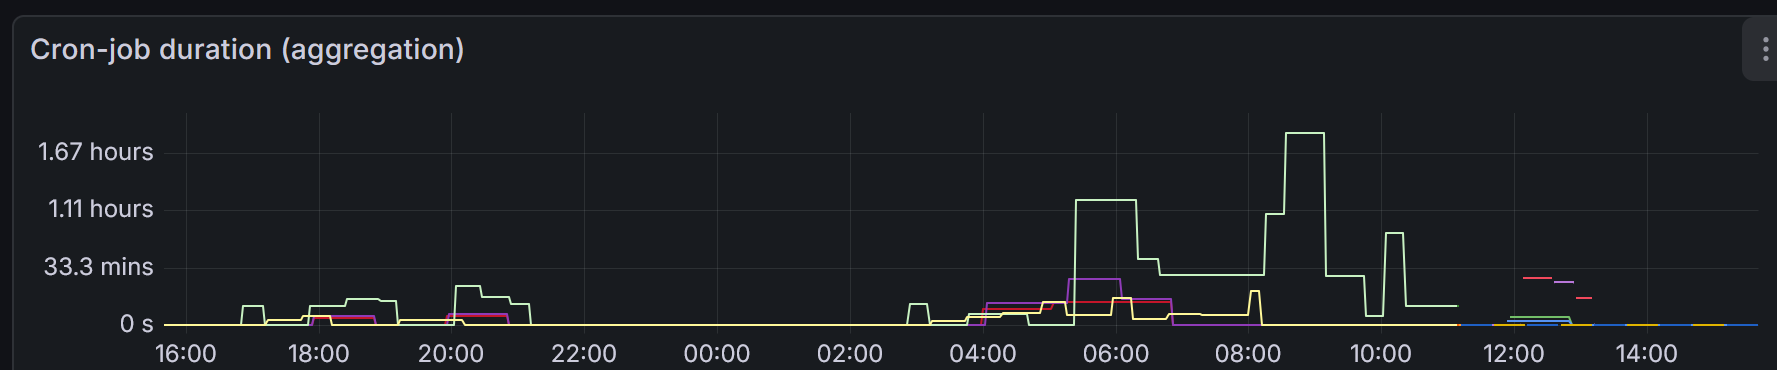 Cron-job duration metric as seen via pushgateway
dealing with container and process replication
In the operational environment the process responsible for gathering a metric can be distributed over different instances. This occurs when a container is deployed in multiple pods in a ReplicaSet in Kubernetes, or when multiple parallel processes are spawned inside a container. This presents a problem for metric analysis, as the metric collection happens in independent processes each having separate memory.
In the case of a ReplicaSet, Prometheus can be configured to attach an unique label, typiacally called pod to the metric for each separate pod. Prometheus then tracks the metric of each pod as separate time-series, which can be aggregated by Grafana at query level. The example shows how a rate is calculated on the individually exposed metric wdqmsapi_nwp_nr_downloads_total which are then aggregated across labels.
sum(irate(wdqmsapi_nwp_nr_downloads_total[$__rate_interval])) by (file_type,period_type)In the case of multiple processes running inside a pod, such as for example several instances of Django spawned by uWSGI, Prometheus cannot distinguish the processes running inside a pod, each of which tracks its own independent instance of the metric. The value of the metric as seen from outside by Prometheus then corresponds to the metric of whichever process responds to the metric harvesting request at that moment in time, resulting in an unstable (and incorrect) pattern as can be seen in the figure below.
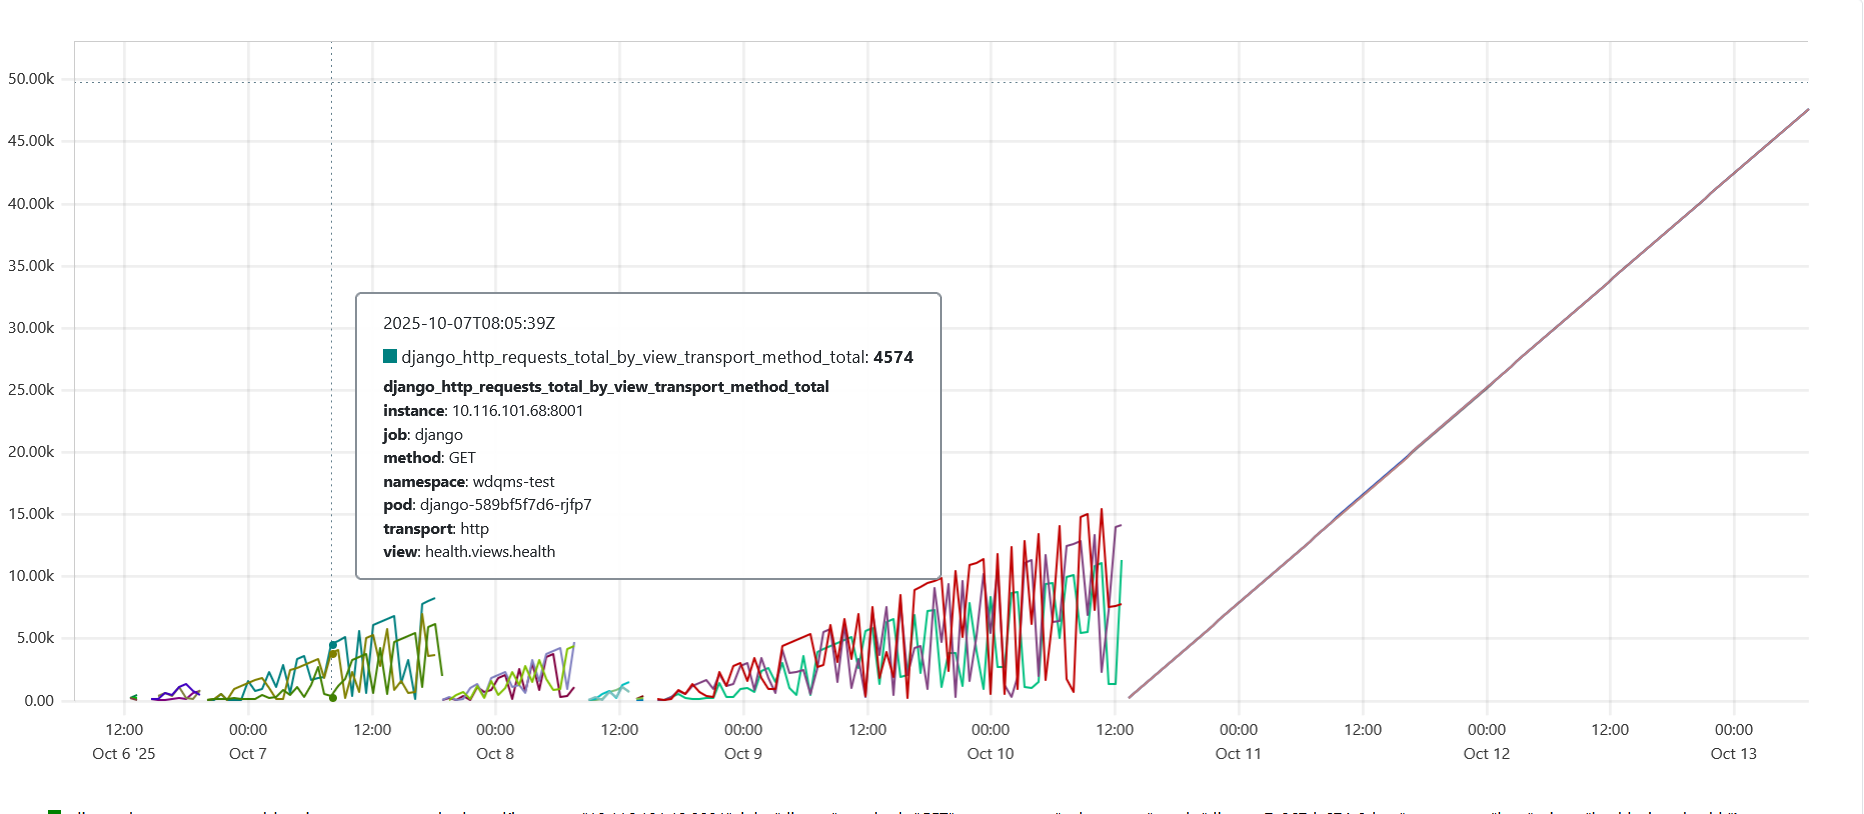 Metric calculated by multiple processes before and after correctly configuring prometheus_client for multiprocess mode
In the case of the prometheus_client python package used by WDQMS (and in Django), enabling multiprocess_mode in the prometheus_client configuration activates a wrapper which reconciles the individual metric instances across processes (for selected metric types) before exposing them.
conclusion
Implementation of metrics increased the stability of WDQMS, as the team has been able to identify and respond to errors faster than before. The metrics provided by the data-processing jobs have allowed us to better understand the system behaviour, particularly when and how files made available by NWP centers are processed. The availability of metrics over time from all components assures us to have enough contextual information available should an incident araise, or should we need it for future resource planning.